
Grafana
Grafana is an open source platform for monitoring and observability. Grafana allows you to query, visualize, alert on and understand your metrics no matter where they are stored. Create, explore, and share dashboards with your team and foster a data driven culture.
Grafana is a tool that is used to create dashboards. Dashboards consists of Panels which are used to visualize data in many ways. Grafana has many types of panels available to visualize your data in many forms. Such panels include Graphs, Tables, Single stats, etc. But what if you want to use the Grafana but show data in your own format. Grafana allows that as well. These components are known as plugins.
In this post we will see how to make our own custom plugin and use it in our Grafana dashboard.
Requisites:
- npm or yarn
- Git
First download the Grafana repo from Grafana website
https://grafana.com/grafana/download
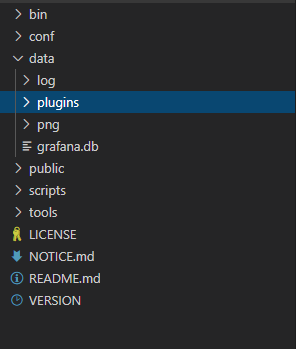
Then clone Hello World Custom panel with the command written below in the folder data/plugins or var/lib/grafana/plugins. If no such folder exists in root directory create one.Git clone https://github.com/grafana/simple-angular-panel
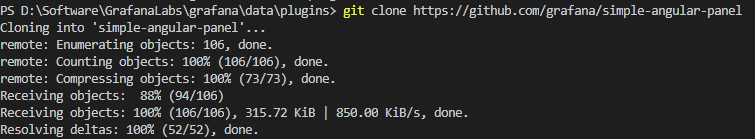
This folder will be created in your data/plugins.
Install the dependencies required for that panel using npm install or yarn. Then build the plugin using yarn build or npm run build. (Running the build script defined in package.json)
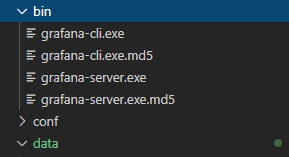
Then start the grafana-server:
- By running the command
./bin/grafana-serverin the root directory of your grafana repo (Linux). - By running the grafana-server.exe in bin Folder (Windows).
Then panel will be availables in your visualization section when you create a new panel
![]()
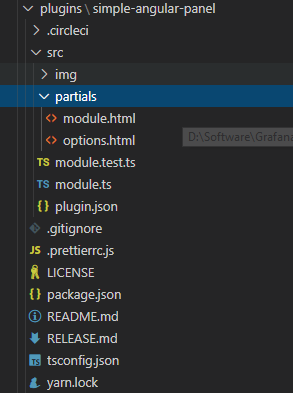
Plugin.json
It defines your panel and uniquely identifies it.
1 | { |
- “name”: Name Displayed on panel
- “id”: Unique Identified of your plugin. If two panels have same ID only 1 will be shown
- “logos”: shows the images shown for your panel which can be found in src/img folder.
Module.ts
It is the entry point of your panel. Functions and variables can be created in module.ts and be used In html page using “ctrl” as the object of the class.
Front HTML Page.
This page can be found at partials/module.html.
So if you create a variable named “text” in the SimpleCtrl Class (in module.ts). It can be accessed in HTML page using ““.
Options.html page contains the page the visualization section which is shown when you create or edit a panel.
After You create your html pages and functionality in module.ts, you can run npm run build or yarn build and use the panel in your own Grafana however you like.
Tips : If you want to see changes in your panel while you are creating it. Use
npm run watchoryarn watch. It implements changes as you make them. It basically creates build with environment settings as development. You can see the changes by refreshing the webpage.
References: