Animation Configuration
Chart.js animates charts out of the box. A number of options are provided to configure how the animation looks and how long it takes.
The following animation options are available. The global options for are defined in Chart.defaults.global.animation.
Duration: Number of milliseconds an animation takes to complete
Easing:
lineareaseInQuadeaseOutQuadeaseInOutQuadeaseInCubiceaseOutCubiceaseInOutCubiceaseInQuarteaseOutQuarteaseInOutQuarteaseInQuinteaseOutQ
Animation Callbacks
The onProgress and onComplete callbacks are useful for synchronizing an external draw to the chart animation. The callback is passed a Chart.Animation instance:
1 | { |
Example of preogress bar animation
1 | var chart = new Chart(ctx, { |
Legend Configuration
The chart legend displays data about the datasets that are appearing on the chart.
Position
Position of the legend. Options are:topleftbottomright
Align
Alignment of the legend. Options are:startcenterend
Legend Item Interface
Items passed to the legend onClick function are the ones returned from labels.generateLabels. These items must implement the following interface.
1
2
3
4
5
6
7
8
9
10
11
12
13
14
15
16
17
18
19
20
21
22
23
24
25
26
27
28
29
30
31
32
33
34{
// Label that will be displayed
text: string,
// Fill style of the legend box
fillStyle: Color,
// If true, this item represents a hidden dataset. Label will be rendered with a strike-through effect
hidden: boolean,
// For box border. See https://developer.mozilla.org/en/docs/Web/API/CanvasRenderingContext2D/lineCap
lineCap: string,
// For box border. See https://developer.mozilla.org/en-US/docs/Web/API/CanvasRenderingContext2D/setLineDash
lineDash: number[],
// For box border. See https://developer.mozilla.org/en-US/docs/Web/API/CanvasRenderingContext2D/lineDashOffset
lineDashOffset: number,
// For box border. See https://developer.mozilla.org/en-US/docs/Web/API/CanvasRenderingContext2D/lineJoin
lineJoin: string,
// Width of box border
lineWidth: number,
// Stroke style of the legend box
strokeStyle: Color,
// Point style of the legend box (only used if usePointStyle is true)
pointStyle: string | Image,
// Rotation of the point in degrees (only used if usePointStyle is true)
rotation: number
}
Example
The following example will create a chart with the legend enabled and turn all of the text red in color.
1 | var chart = new Chart(ctx, { |
Tooltip
Tooltip Configuration
Position Modes
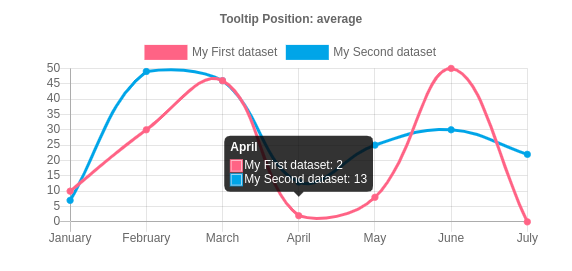
Possible modes are:averagenearest
Alignment
The titleAlign, bodyAlign and footerAlign options define the horizontal position of the text lines with respect to the tooltip box. The following values are supported.leftrightcenter
Tooltip Callbacks
Label Callback
The label callback can change the text that displays for a given data point. A common example to round data values; the following example rounds the data to two decimal places.
1
2
3
4
5
6
7
8
9
10
11
12
13
14
15
16
17
18
19var chart = new Chart(ctx, {
type: 'line',
data: data,
options: {
tooltips: {
callbacks: {
label: function(tooltipItem, data) {
var label = data.datasets[tooltipItem.datasetIndex].label || '';
if (label) {
label += ': ';
}
label += Math.round(tooltipItem.yLabel * 100) / 100;
return label;
}
}
}
}
});Label Color Callback
For example, to return a red box for each item in the tooltip you could do:
1
2
3
4
5
6
7
8
9
10
11
12
13
14
15
16
17
18
19var chart = new Chart(ctx, {
type: 'line',
data: data,
options: {
tooltips: {
callbacks: {
labelColor: function(tooltipItem, chart) {
return {
borderColor: 'rgb(255, 0, 0)',
backgroundColor: 'rgb(255, 0, 0)'
};
},
labelTextColor: function(tooltipItem, chart) {
return '#543453';
}
}
}
}
});Tooltip Item Interface
The tooltip items passed to the tooltip callbacks implement the following interface.
1
2
3
4
5
6
7
8
9
10
11
12
13
14
15
16
17
18
19
20
21
22
23
24
25
26
27{
// Label for the tooltip
label: string,
// Value for the tooltip
value: string,
// X Value of the tooltip
// (deprecated) use `value` or `label` instead
xLabel: number | string,
// Y value of the tooltip
// (deprecated) use `value` or `label` instead
yLabel: number | string,
// Index of the dataset the item comes from
datasetIndex: number,
// Index of this data item in the dataset
index: number,
// X position of matching point
x: number,
// Y position of matching point
y: number
}
